Introduction
The Statistical Package
MathymaStats is a basic statistics package written in JavaScript. It can be used to analyse data from input files, the statistical analysis output can be printed in a HTML document (e.g. a Web page).
MathymaStats offers basic summary statistics, a number of graphical display facilities, and analysis of Linear Models - i.e. linear regression with several explanatory variables, and multi-way analysis of variance. As well as these purely statistical functions, MathymaStats includes a module to support matrix algebra on your Web page. More functionality is planned - so watch this space.
An example of graphical output
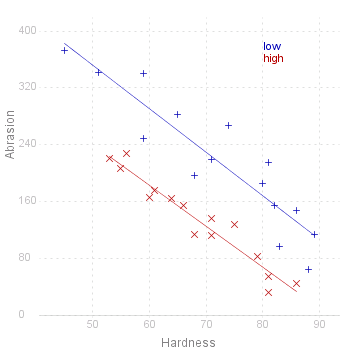 |
The MathymaStats functions are an integral part of your Web page, so that all HTML formatting facilities can be used. You don't have to know JavaScript to make use of the package, but for those who are familiar with JavaScript, MathymaStats provides basic data analysis functions which could be used as part of a tailor-made analysis.
Using MathymaStats
MathymaStats is built up of a number of JavaScript files. These files are included in the Mathyma download.
MathymaStats is written as Object Oriented modules. (Don't worry if this is new to you). It provides a number of "methods" or "functions". The description of each method in the following pages will include the names of the files to be included in your HTML page.
Lets look at an example. You have an XML file of data which records the height and weight of a number of pupils at schools in London and Cardiff. (This is completely made-up data.)
You want to summarise the height and weight distribution. To do this you will need the DataBlock method "Summary". This is defined in MathymaStats.js, so you will need the following line in thepart of your HTML page:
< script src="MathymaStatsControl.js" type="text/javascript" >< /script >
Remember to have the file in the same directory as your Web page. (You can put it in another directory, but you'll then have to change the src parameter in the tag.)
The JavaScript is then written in your HTML page at the point you want the summary to appear:
< script >
   var pupilData = new mathyma.stats.DataBlock("StatsData/pupil.xml");
   pupilData.ViewXML();
   pupilData.AddVariables ("HEIGHT;WEIGHT");
   pupilData.AddFactors ("TOWN");
   pupilData.Summary ("HEIGHT");
   pupilData.Summary ("WEIGHT");
< /script >
Source for the graphs shown on this page can be viewed by going to the diagram capture page .